Tag: strava
-
Playing With Our Sports Data With Eleventy and Strava
Reading Time: 3 minutesThis month Apple wants me to walk ten point three kilometres with the Apple Watch 10 times. Garmin and Strava want me to cycle 8000m uphill, 800km horizontally, and more. Apple, Garmin and one or two other companies want me to walk 300,000 steps per month. Now, I have two ways of…
-
The Zero Second Not a Number Strava Mystery
Reading Time: 3 minutesYesterday I noticed that I had an unusual workout that was getting likes. It had zero minutes of exercise, zero distance travelled, and NaN speed in km/h. In other words I had a track that should not have been counted by Strava as a workout. Everyone is familiar. If you go for…
-

An Eleventy Strava Experiment in Three Parts
Reading Time: 3 minutesFor the last two days I have been experimenting with reproducing my Strava timeline in Eleventy using a CSV file, for a change, as well as a JavaScript file to import new GPX files and map them correctly for the CSV file. That CSV file is then read by Eleventy to populate…
-
The Declining Case for Social Media Giants
Reading Time: 3 minutesYears ago I was interviewed by the RTS to speak about Twitter and my conclusion is that it would never pick up in Switzerland because there are too few users and they’re too dispersed. That is still true. Social networks that are alive and well are Meetup, GoSocial, Strava and Whatsapp. It’s…
-

Strava Conversational Tools
Reading Time: < 1 minuteThe sun is shining. For a day or two the grey Autumn weather is gone. This would be a good time for a spontaneous bike ride. The issue with this is that Strava is great for sharing activities that are planned in advance, and those that have passed. It’s easy to…
-

The Strava IPO and My Desire To Quit the App
Reading Time: 3 minutesStrava intends to float itself on the stock exchange. In my experience of Twitter, Facebook and other social media apps this is the beginning of the end for the app. In my experience when an app such as Zwift gets VC funding it loses control of its app. Users go from being…
-
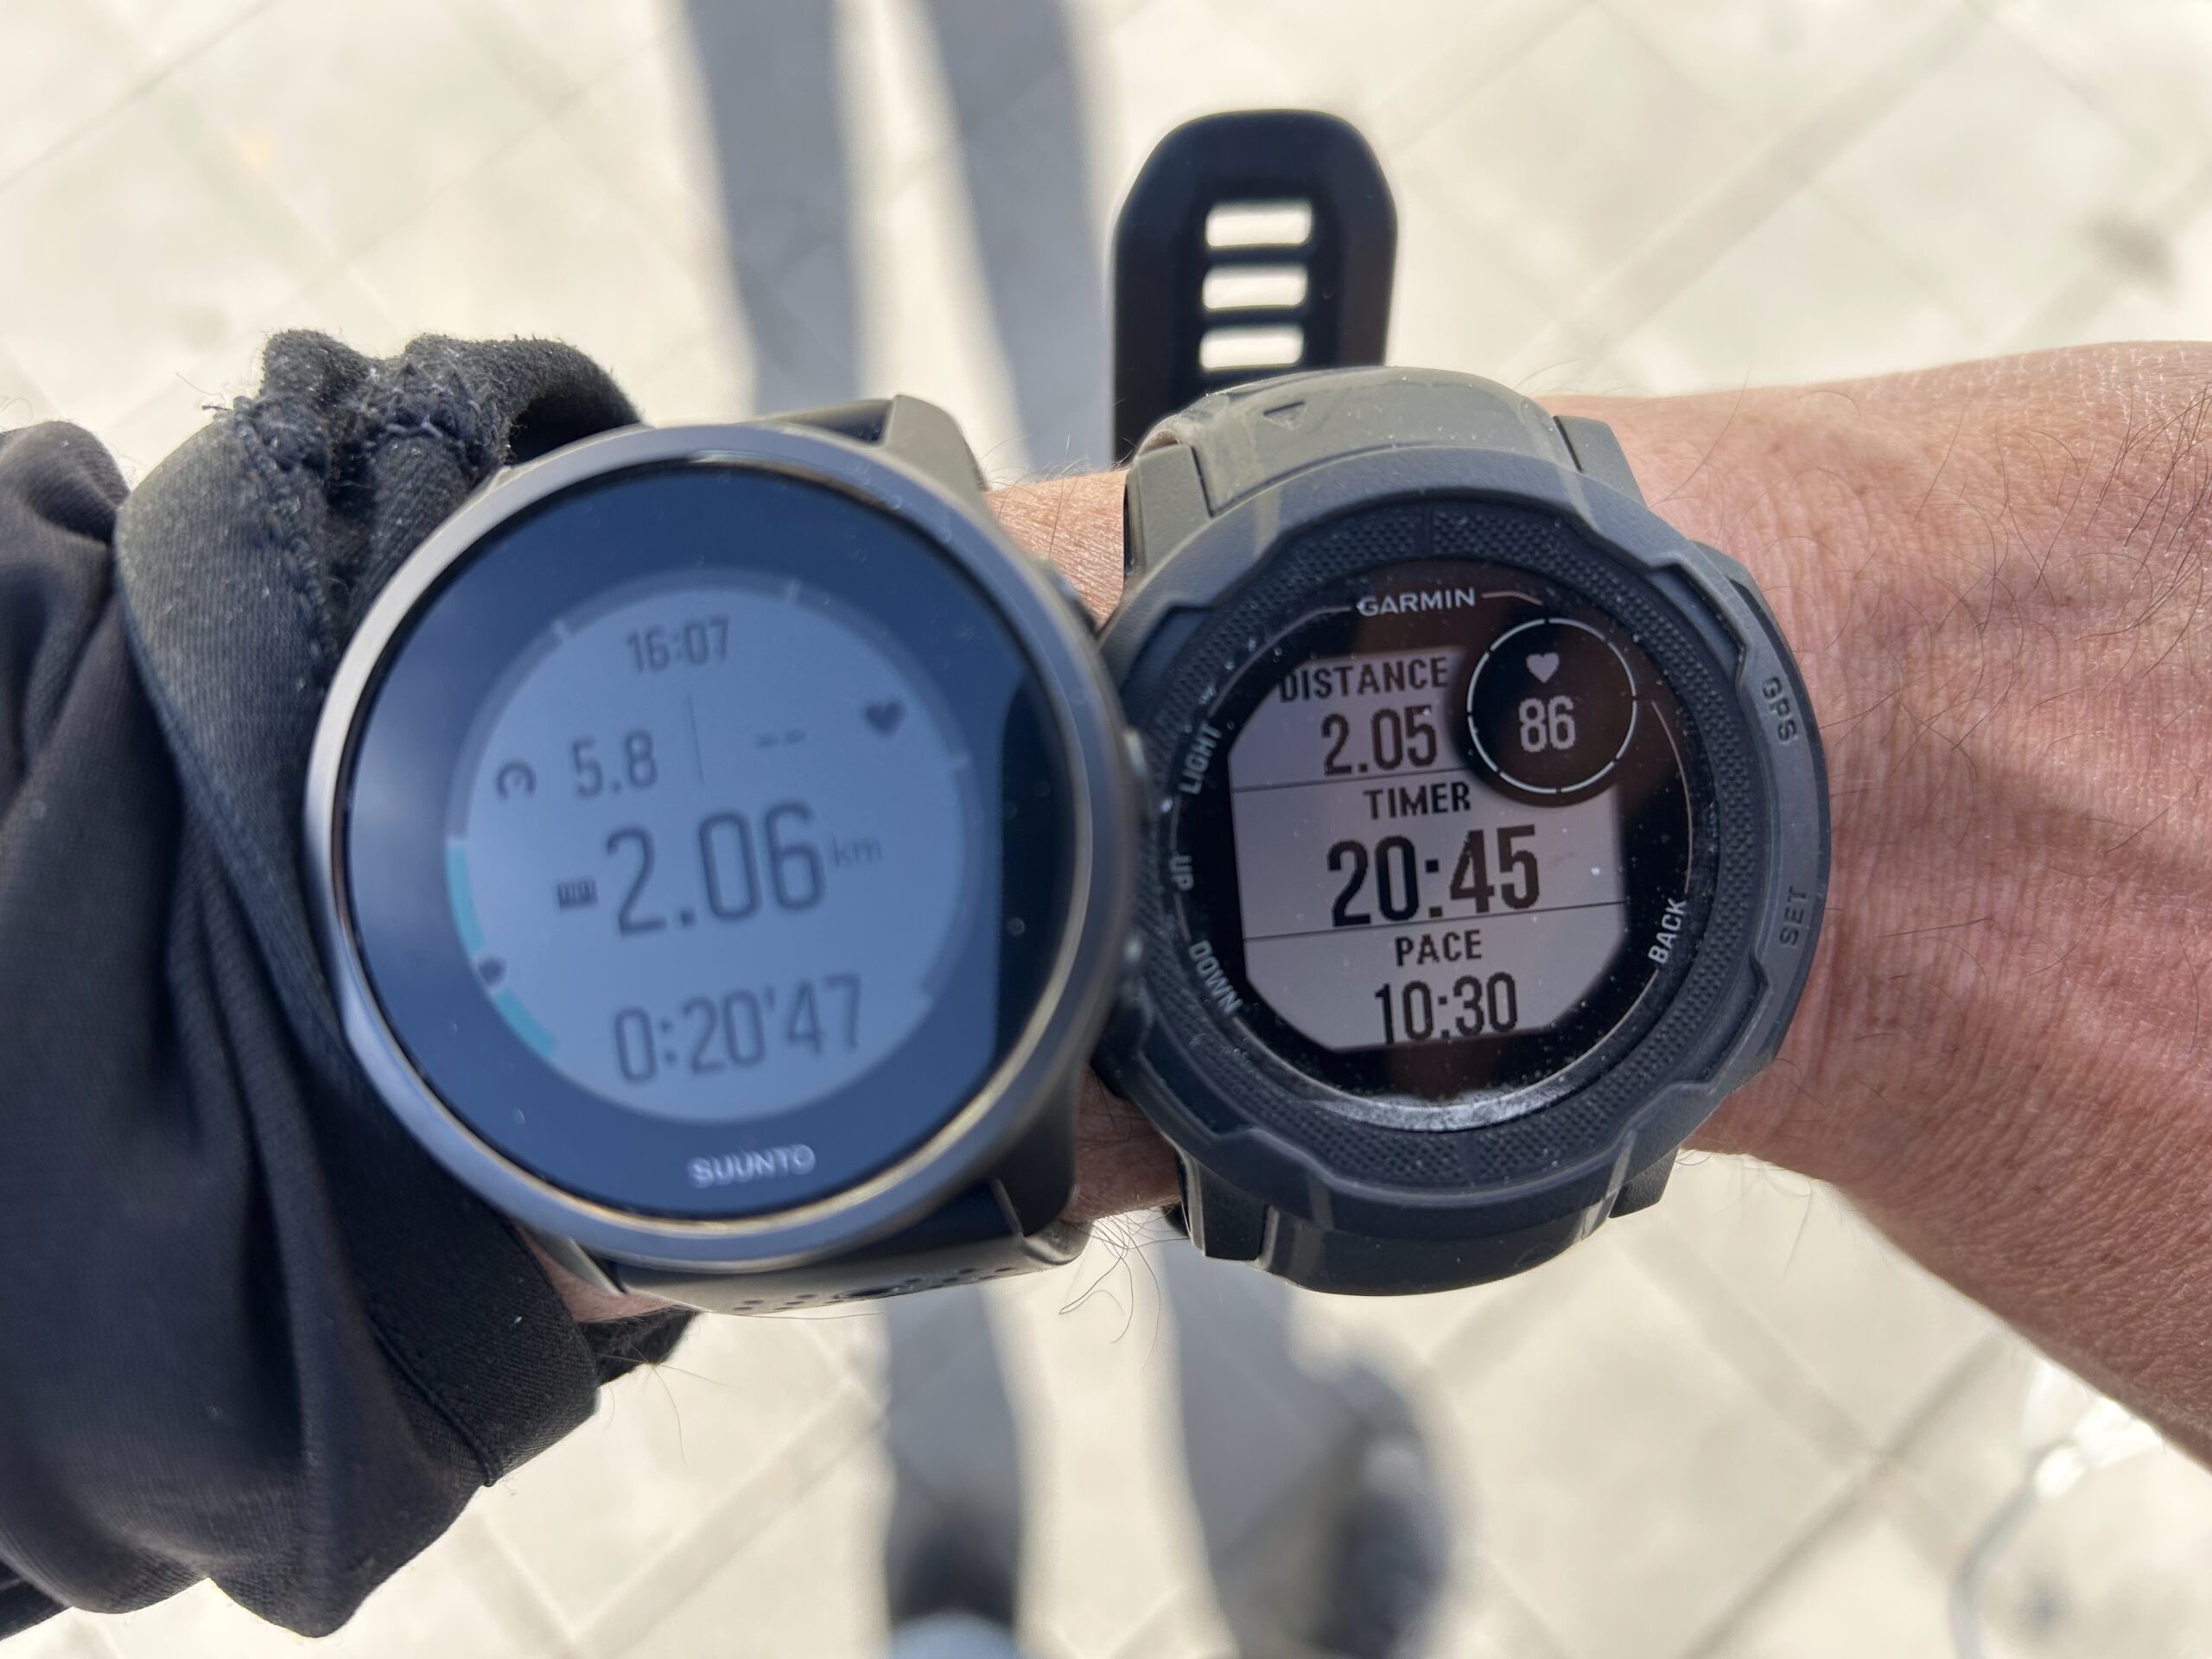
Strava – How to Upload Manually
Reading Time: 2 minutesSince Strava has decided to sue Garmin, and since Suunto has decided to sue Garmin as well, for different reasons, I feel now is a good opportunity to remind ourselves of how to upload to Garmin and Strava manually. Exporting to Strava Garmin If you record an activity with a Garmin device,…
-
Sports Tracker is Waking Up
Reading Time: 2 minutesIn the 2000s I was using a Nokia N95 8gb with Sports tracker to track my walks every day. Eventually, when I started scuba diving I switched to Suunto to track dives, and eventually wore one for hikes, and then I upgraded to the Suunto Ambit 2, 3, Spartan Wrist HR Baro…
-

On Strava Being Irrational
Reading Time: 2 minutesIt is irrational and absurd for Strava to sue one of its’ most important providers of data, Garmin. Every run, hike, climb and other sport that I have done for years comes from either Suunto, Garmin, Apple Watch or another brand. Garmin is huge in the cycling community. I see people with…
-

A Run Recommended by Strava
Reading Time: 2 minutesWhen you drive to a place you don’t have a place for it. That’s why it’s good to use sites to find recommendations. Usually I like to explore routing opportunities with Komoot, to look at routes, what they offer as sites and sounds, and how long the route is. Last night and…